Pre-market gaps and intraday movers across every listed stock and ETF, with relative volume, VWAP and the latest headline.
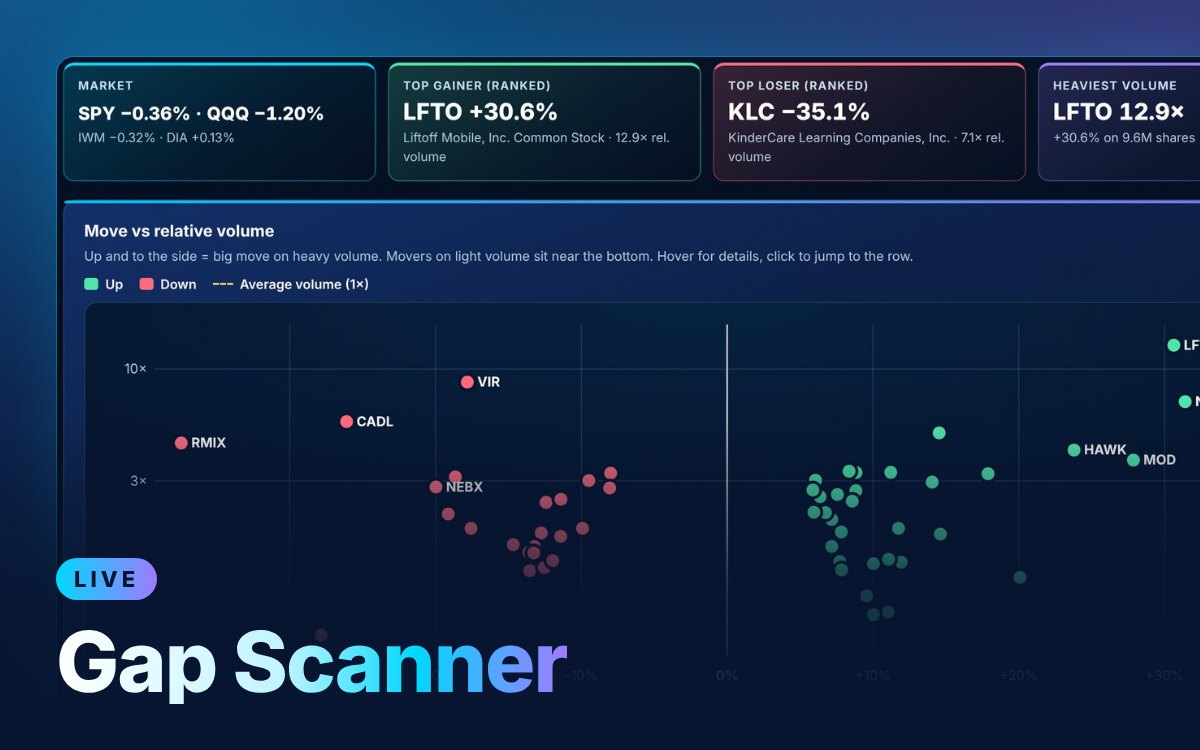
Sample screen. Subscribers see live data.
Options Flow, Gamma Levels, the Gap & Mover Scanner, the Volatility Screener, Expected Move, Options X-Ray, Unclouded Charts, the Options Chain and My Watchlist, for any symbol.
Every live tool, with AI explanations. 7-day free trial, then $49 a month. Cancel anytime.
Start 7-day free trialEvery live tool, with AI explanations. 7-day free trial, then billed once a year.
Start 7-day free trialEvery live tool plus the Unclouded Journal in one subscription, $9 a month less than buying both (Live Tools $49 + Journal $19). 7-day free trial.
Your card is charged when the free trial ends unless you cancel before then. Cancel anytime from your account.
A narrated walkthrough on real market data: what to look at first, what each number means and how traders use it.
Before the open it shows pre-market gaps; during the session it shows the day's movers versus yesterday's close. Each row has relative volume, price versus VWAP and the latest headline.
Today's volume so far, including pre-market, divided by the average full-day volume over the last 20 sessions. A gap on heavy relative volume carries more weight than one on light volume.
Every listed stock and ETF is checked every few minutes from 4:00 am Eastern through the trading day.
Enter the email you subscribed with and we'll send a one-time sign-in link.
