
Coming soon
Pullback Continuation
Spots a stock in an intraday uptrend that pulls back and resumes higher, then plans the trade: entry, stop, target and position size. 5-minute charts.
See the study →Everything Market Unclouded makes for thinkorswim in one place: the Setup Guide that makes the platform look and work like the charts in our books, and the studies that turn our setups into lines, labels and signals on your chart.
Spots a stock in an intraday uptrend that pulls back and resumes higher, then plans the trade: entry, stop, target and position size. 5-minute charts.
See the study →Maps the opening range, regular-session VWAP, prior close and premarket levels, and flags the opening-range breakout and gap-fill setups from Trading the Open.
See the study →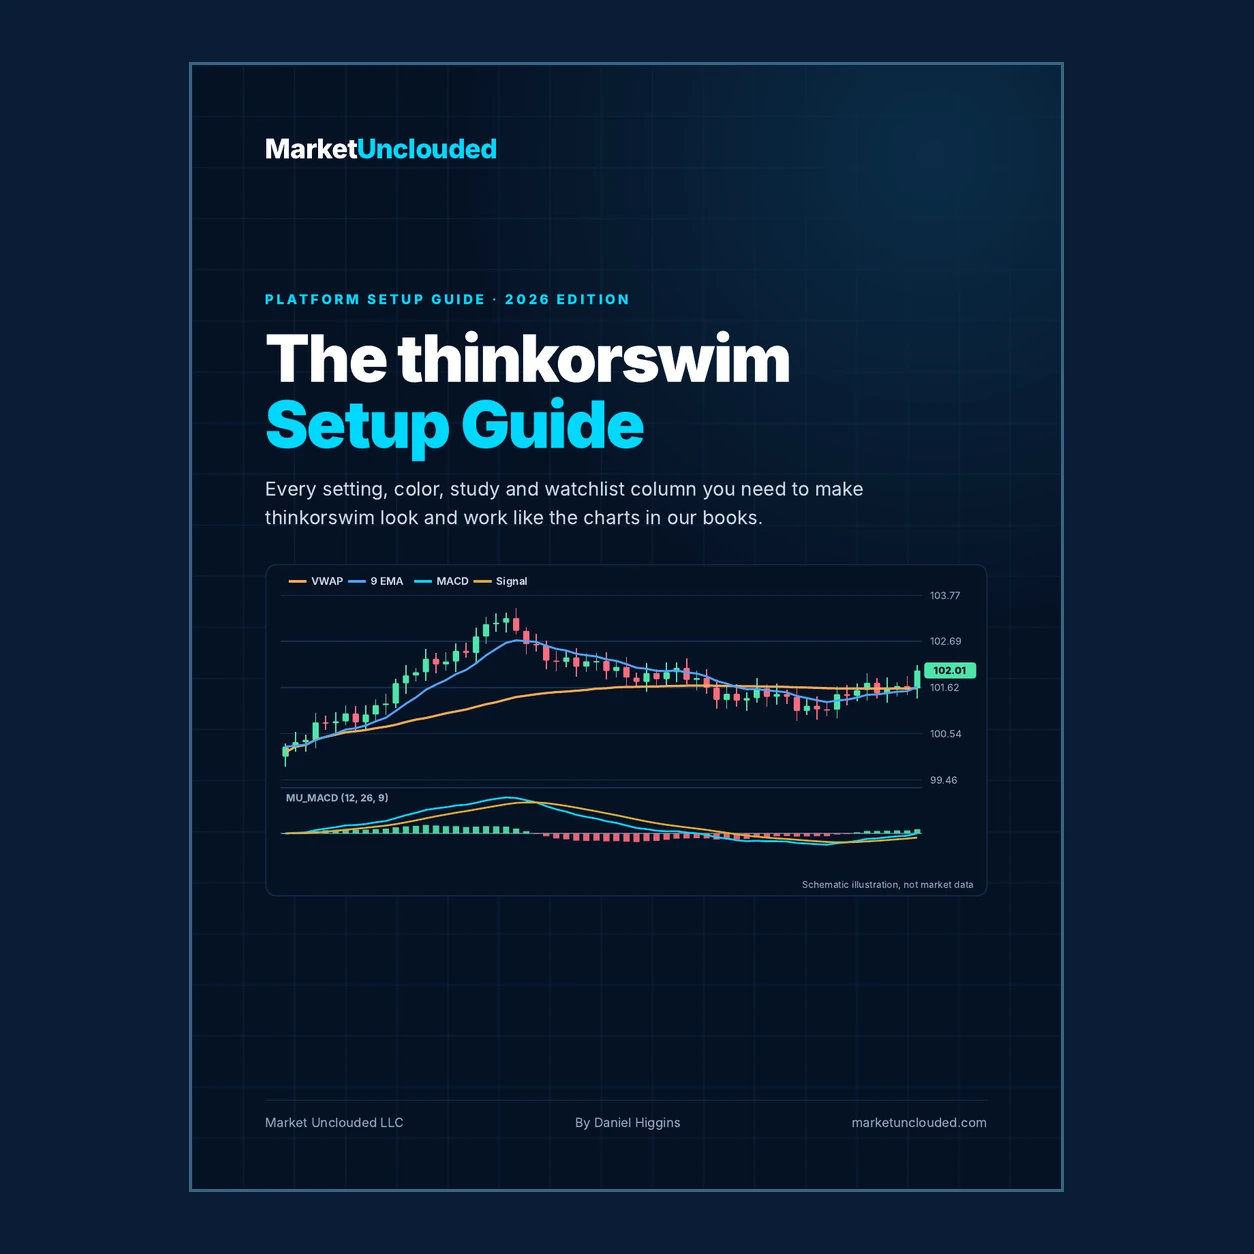
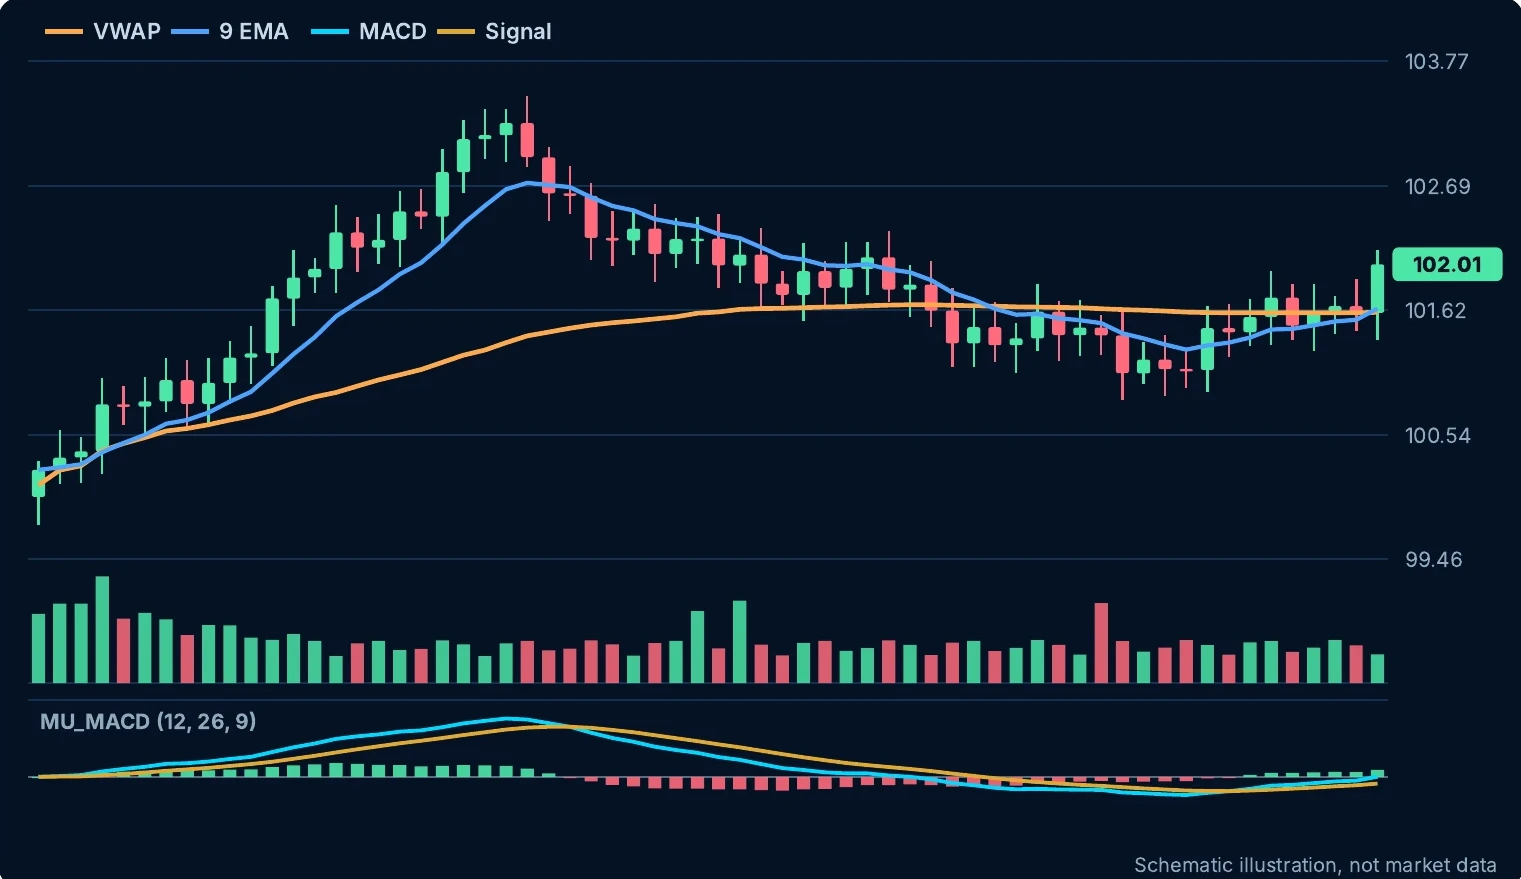
Chart style (VWAP, 9 EMA and brand candles), MACD and volume studies, plus eight watchlist columns including the 5-minute MACD trend state.
See the Setup Guide →See the market the way our books draw it. The color scheme, chart settings, core chart studies and watchlist columns that make thinkorswim look and work like the charts in the Masterclass and Trading the Open, listed in the order they appear on screen.
Educational use only. The studies and columns are charting tools: they do not give advice or place trades.
Step-by-step instructions with hex and RGB values for every color, ready-to-paste code for the three chart studies and eight watchlist columns, and a printable reference card.
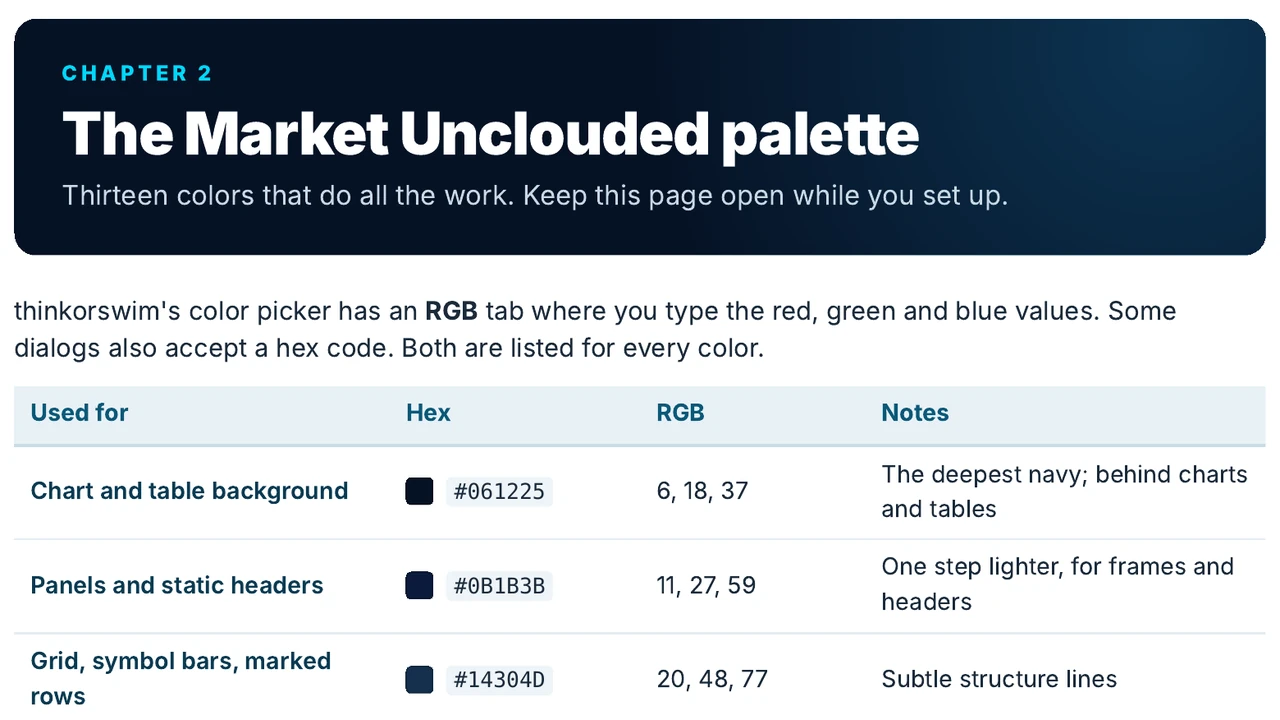
A custom Look and Feel scheme that puts watchlists, tables, headers and panels on the same navy as your charts.
Every Appearance setting in on-screen order: candles, cursor, volume coloring, background and grid.
VWAP and 9 EMA, MACD and volume in the colors used throughout the Masterclass and Trading the Open.
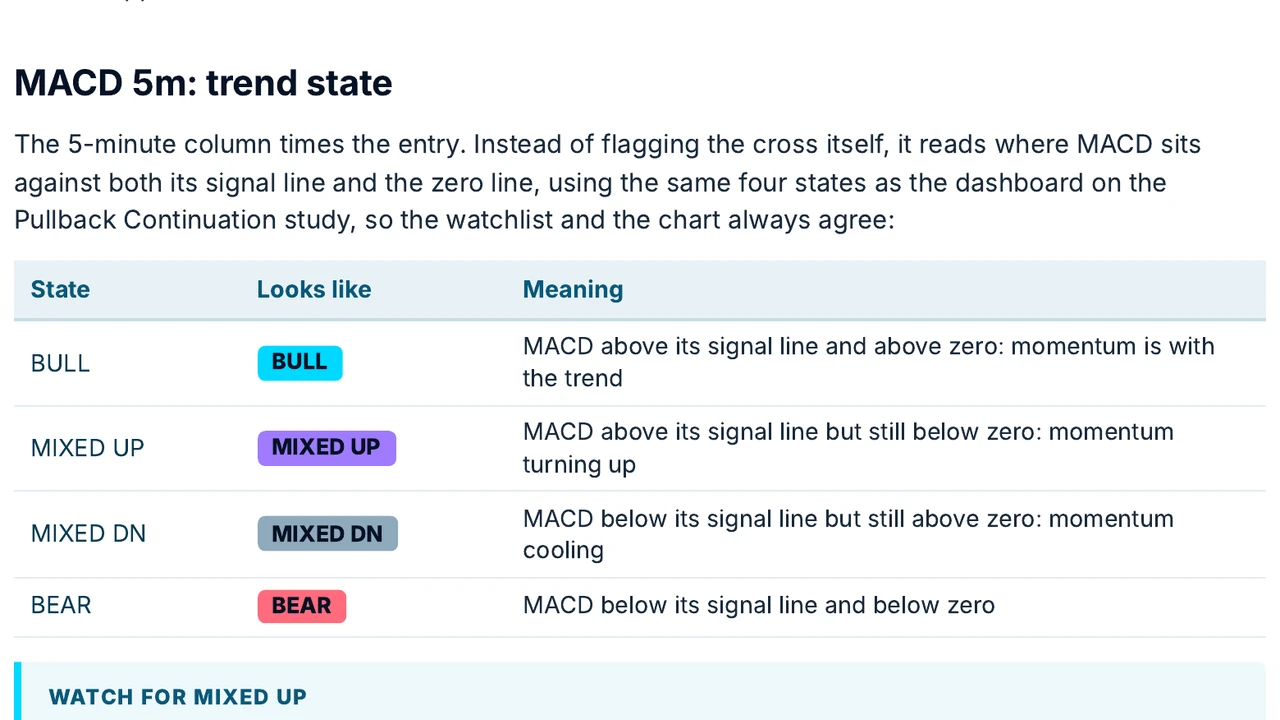
MACD bias on 30 and 15 minutes, a 5-minute MACD trend state that matches the Pullback Continuation dashboard, time-of-day RVOL, breakout-bar volume, VWAP %, opening-range status and ATR %.
How the columns line up with the process: trend first, pullback second, execution last.
Fixes for the most common setup problems, and a printable one-page quick-reference card.
Pages from the guide: the finished chart, the color scheme, the watchlist and the 5-minute MACD trend states.
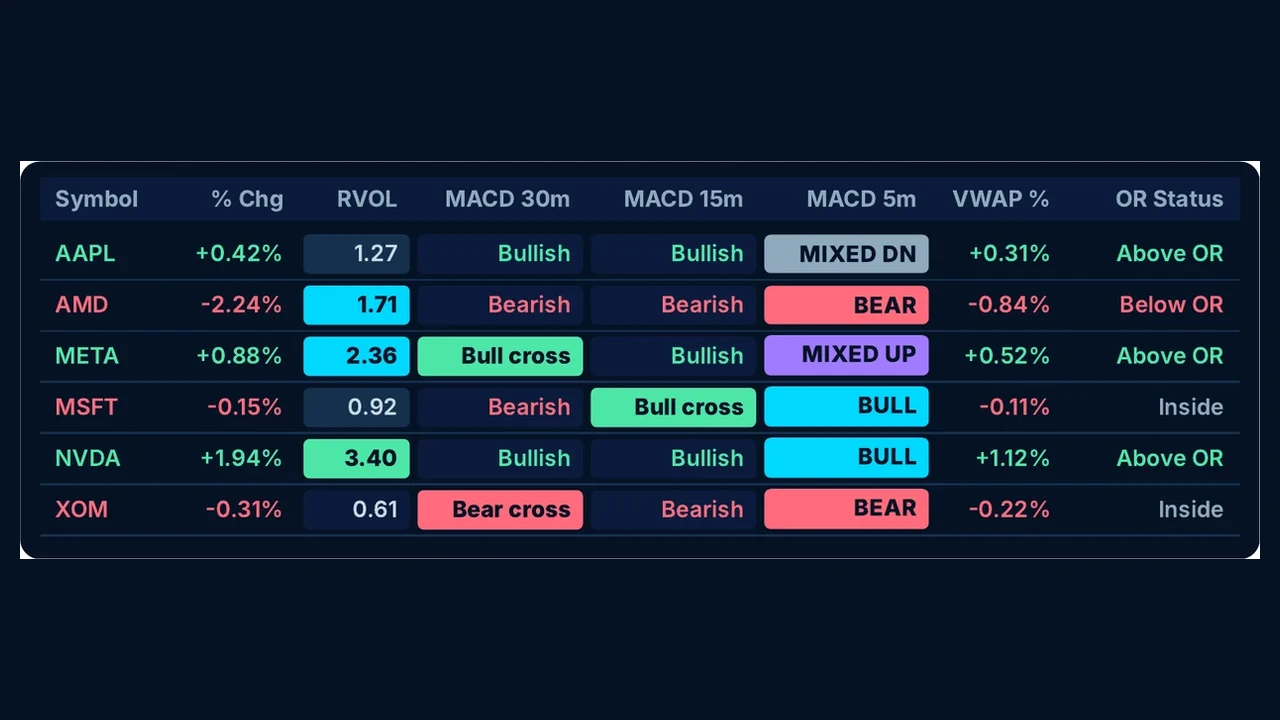
Arranged left to right in the order you make the decision. The moment a column fails, move on to the next stock.
A bull cross or bullish reading on the 30-minute chart sets the bias.
A bullish 15-minute reading confirms it.
Above 1.5 means the stock is trading more volume than usual for this time of day.
MACD 5m turns MIXED UP, then BULL, and price breaks above VWAP with Bar RVOL of 2 or more on the breakout bar.
Everything is printed in the guide and also included as separate files, so you never have to retype code.
Not included: the strategy studies, such as the Opening Range Study and the Pullback Continuation Study, are sold separately. See the studies below.
Requires the thinkorswim desktop application. This is a downloadable guide, not live instruction, signals, personalized advice or automated trading software. thinkorswim is a trademark of Charles Schwab & Co., Inc. Market Unclouded is not affiliated with or endorsed by Charles Schwab.
Strategy studies built from the Masterclass and Trading the Open. Both are in testing and sold separately from the Setup Guide.
A thinkorswim study that spots when a stock in an established intraday uptrend pulls back and resumes higher, then lays out a complete trade plan on your chart.
The study turns the Market Unclouded pullback framework into clear, rules-based signals. It looks for a specific pattern, checks it against a set of quality filters, and only then shows a signal with the risk already defined.
Confirms the trend on higher timeframes, waits for a controlled pullback to the short-term moving average, and signals when price resumes higher above VWAP.
Checks broad-market direction, time-of-day relative volume, volume on the breakout, and how stretched price is, and pauses during the typically thin midday session.
Every signal comes with an entry, a stop anchored to recent market structure, a defined profit target, and a position size based on the dollar risk you choose.
Follows each signal to its stop, target or the session close, marks the outcome on the chart, and keeps a running tally across your chart history.
Signals print only after the setup candle has closed, so an arrow never appears mid-bar and then disappears.
The stock is in an intraday uptrend, confirmed on higher timeframes.
Price dips back to the short-term moving average in a controlled retracement.
A strong candle closes higher while holding above both the moving average and VWAP.
Once the candle closes and the filters agree, the signal and trade plan appear.
The study keeps the chart uncluttered and puts its status in a compact dashboard: higher-timeframe trend, setup status, relative volume and a results summary.
| Platform | thinkorswim desktop |
|---|---|
| Chart | 5-minute, regular trading hours |
| Instruments | Liquid U.S. stocks and ETFs |
| Direction | Long setups |
| Adjustable | Filters, times, reward target and dollar risk |
| Order execution | None. Chart study only |
| Status | In final testing |
The study's dashboard rates the 30-minute and 15-minute trend as BULL, MIXED or BEAR. The MACD 5m watchlist column in our thinkorswim Setup uses the same rules on the 5-minute chart, so you can scan a whole list for stocks whose pullback momentum is turning before you open a single chart.
Look for names that are BULL on the higher timeframes with the 5-minute column moving from MIXED DN or BEAR to MIXED UP, then open the chart and let the study confirm the setup.
Watchlist columns find candidates; the chart makes the decision.
A thinkorswim study for the first hour of the trading day. It maps the levels that matter at the open and flags the setups taught in our upcoming book, Trading the Open.
Draws the 15-minute opening range, a regular-session VWAP that resets at 9:30, the prior close and the premarket high and low.
Marks opening-range breakouts with volume and VWAP confirmation, and gap-fill VWAP reclaims, once per day after the candle closes.
Labels for gap size, position versus the range and VWAP, relative strength against SPY or QQQ, and volume.
Waits out the first 15 minutes, highlights when the range is set, and marks a configurable end-of-day time stop.
The Opening Range Study is in development. Features may change before launch. It is a charting tool only: it does not provide investment advice or place trades.
A time-of-day relative volume column you can paste into your thinkorswim watchlist today, with install steps and how to read it, plus a primer on trading the opening range.
The opening range is the high and the low a stock trades in during the first minutes of the regular session, which starts at 9:30 a.m. Eastern. Most traders use the first 15 minutes, so the range is set at 9:45.
Those two prices matter because the open is when the most orders arrive at once. The range shows where buyers and sellers first agreed on a price for the day. When a stock later closes outside that range, especially with volume behind it, it is often the first sign of the day's direction. That is the idea behind the opening range breakout.
Wait for the range to set. Prices in the first minutes are erratic while overnight orders clear. The range gives you a reason to wait instead of reacting to the first candle.
Look for a close, not a touch. A candle that closes outside the range says more than a wick that pokes through and comes back. A close back inside the range after a breakout is its own setup: the failed breakout.
Check what else agrees. A breakout on rising volume, on the right side of VWAP and in the same direction as the broader market is more convincing than one that happens alone. Before 9:30, also note the prior close and the premarket high and low, because price often reacts at those levels too.
Plan the risk first. Common reference points are a stop on the other side of the range or below the midpoint, and a first target equal to one range height beyond the breakout. Decide these before you enter, not after.
The Market Unclouded Opening Range Study adds a regular-session VWAP, the prior close, premarket high and low, gap and relative-strength labels, and marks the opening-range breakout and gap-fill setups once their rules are met. The full Opening Range Study is coming soon, together with our opening-bell playbook, Trading the Open.
See the full Opening Range StudyA stock that has traded 2 million shares by 10:00 a.m. could be busy or quiet. It depends on what it normally trades by 10:00. And because volume is heavy at the open and close and thin at midday, comparing this morning's volume with a full day's average makes almost every stock look slow before lunch.
Time-of-day relative volume fixes that. It compares today's volume so far with the average volume the same stock had traded by this same time over the last few sessions. An RVOL of 1.0 is a normal day. 2.0 means twice the usual activity for this time of day.
# Market Unclouded - RVOL watchlist column
# Custom column settings: Aggregation 5 m, "Include extended hours" UNCHECKED.
# Compares today's volume so far with the average volume traded by this
# same time of day over the last 5 sessions. 1.0 = normal, 2.0 = double.
# For personal use only. (c) 2026 Market Unclouded LLC
input days = 5;
def newDay = GetDay() != GetDay()[1];
def cumVol = if newDay then volume else cumVol[1] + volume;
def avgCum = (fold i = 1 to days + 1 with s = 0 do s + GetValue(cumVol, i * 78)) / days;
plot RVOL = if avgCum > 0 then Round(cumVol / avgCum, 2) else 0;
RVOL.AssignValueColor(if RVOL >= 1.5 then Color.BLACK else Color.WHITE);
AssignBackgroundColor(if RVOL >= 3 then Color.GREEN else if RVOL >= 1.5 then Color.CYAN else if RVOL < 0.7 then Color.BLACK else Color.DARK_GRAY);
Under 0.7 (dark): quieter than usual. Breakouts on thin volume fail more often.
Around 1.0: a normal day for that stock.
1.5 and up (cyan): unusual interest. This is where most intraday traders start paying attention, because something, often news or a sector move, is bringing extra participants in.
3 and up (green): exceptional activity. Moves can be large in both directions, so size positions accordingly.
Launch details, documentation and availability will be announced on our official X account. Questions in the meantime? Email support@marketunclouded.com.
The Pullback Continuation Study and Opening Range Study are educational and analytical charting tools. They do not provide investment advice or place trades. Any results they display are hypothetical, calculated from historical data with simplified assumptions, and do not guarantee future results. thinkorswim is a trademark of Charles Schwab & Co., Inc. Market Unclouded is not affiliated with or endorsed by Charles Schwab.