Are options cheap or expensive right now? 30-day implied volatility against realized volatility for more than sixty of the most traded stocks and ETFs.
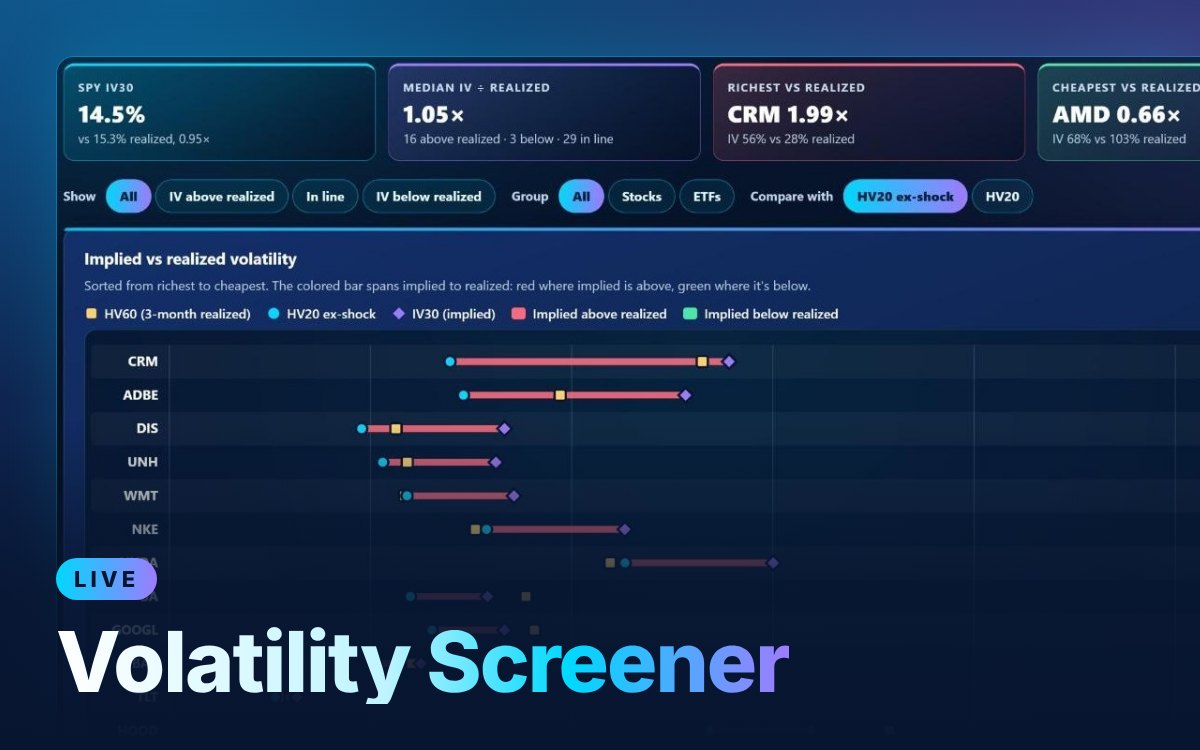
Sample screen. Subscribers see live data.
Options Flow, Gamma Levels, the Gap & Mover Scanner, the Volatility Screener, Expected Move, Options X-Ray, Unclouded Charts, the Options Chain and My Watchlist, for any symbol.
Every live tool, with AI explanations. 7-day free trial, then $49 a month. Cancel anytime.
Start 7-day free trialEvery live tool, with AI explanations. 7-day free trial, then billed once a year.
Start 7-day free trialEvery live tool plus the Unclouded Journal in one subscription, $9 a month less than buying both (Live Tools $49 + Journal $19). 7-day free trial.
Your card is charged when the free trial ends unless you cancel before then. Cancel anytime from your account.
A narrated walkthrough on real market data: what to look at first, what each number means and how traders use it.
New to this? Read Implied vs realized volatility, an easy-to-follow explainer, or look up any term in the glossary.
Implied volatility is what option prices assume the stock will move. Realized (historical) volatility is how much it actually moved. Comparing them shows whether options look rich or cheap.
It divides 30-day implied volatility by realized volatility. Above 1.15 is labeled IV above realized (rich), below 0.85 IV below realized (cheap), and anything in between is in line.
Twenty-day realized volatility with the single largest daily move removed, so one gap day doesn't dominate the comparison.
Enter the email you subscribed with and we'll send a one-time sign-in link.
