See where the large options money is trading today across 38 of the most traded names, with the individual trades behind each flagged contract.
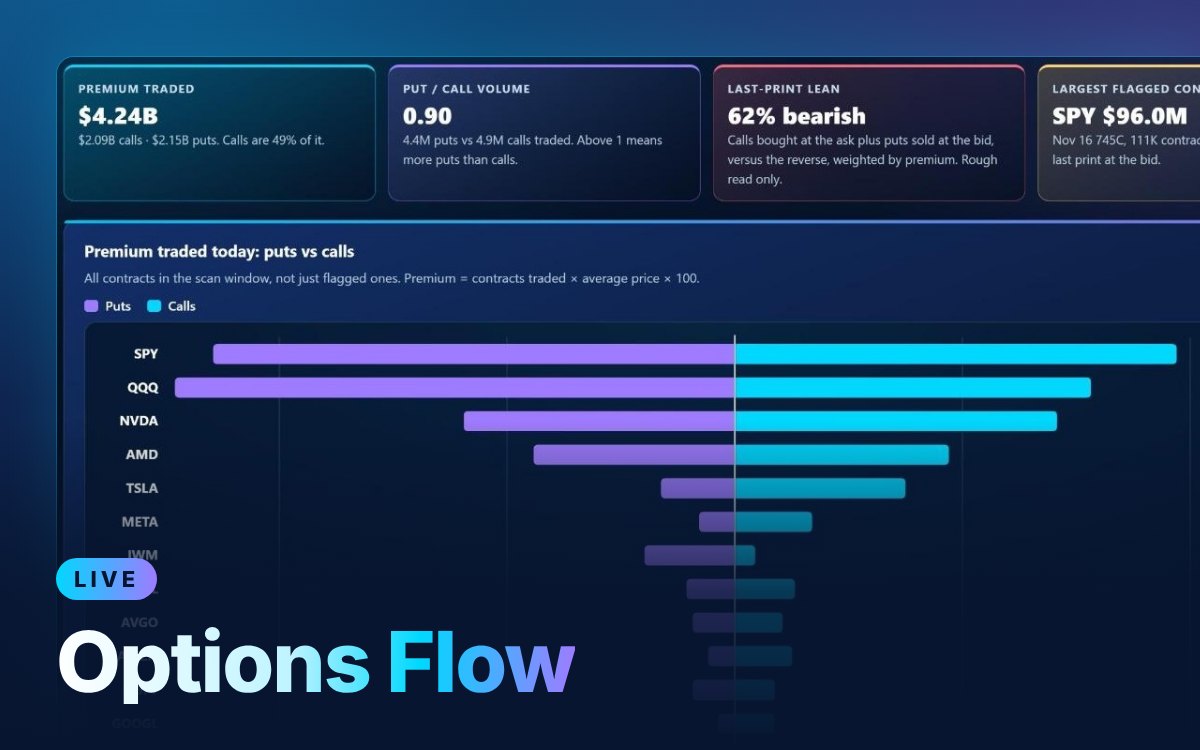
Sample screen. Subscribers see live data.
Options Flow, Gamma Levels, the Gap & Mover Scanner, the Volatility Screener, Expected Move, Options X-Ray, Unclouded Charts, the Options Chain and My Watchlist, for any symbol.
Every live tool, with AI explanations. 7-day free trial, then $49 a month. Cancel anytime.
Start 7-day free trialEvery live tool, with AI explanations. 7-day free trial, then billed once a year.
Start 7-day free trialEvery live tool plus the Unclouded Journal in one subscription, $9 a month less than buying both (Live Tools $49 + Journal $19). 7-day free trial.
Your card is charged when the free trial ends unless you cancel before then. Cancel anytime from your account.
A narrated walkthrough on real market data: what to look at first, what each number means and how traders use it.
New to this? Read What is unusual options activity?, an easy-to-follow explainer, or look up any term in the glossary.
A contract that trades much more volume than its open interest from the day before, or with very large premium. Volume above open interest suggests that at least some of the trades opened new positions.
Every few minutes through the trading day. Each flagged contract shows the premium, volume, open interest, days to expiry and whether the last trade printed nearer the bid or the ask.
No. A large trade can be a hedge, one leg of a spread or a position being closed. Options Flow shows where the money is going; it is information, not a signal to copy.
Enter the email you subscribed with and we'll send a one-time sign-in link.
