See what's really inside an option's price: skew outliers, model vs market price, earnings implied move vs history and a put-call parity check, refreshed after every close.
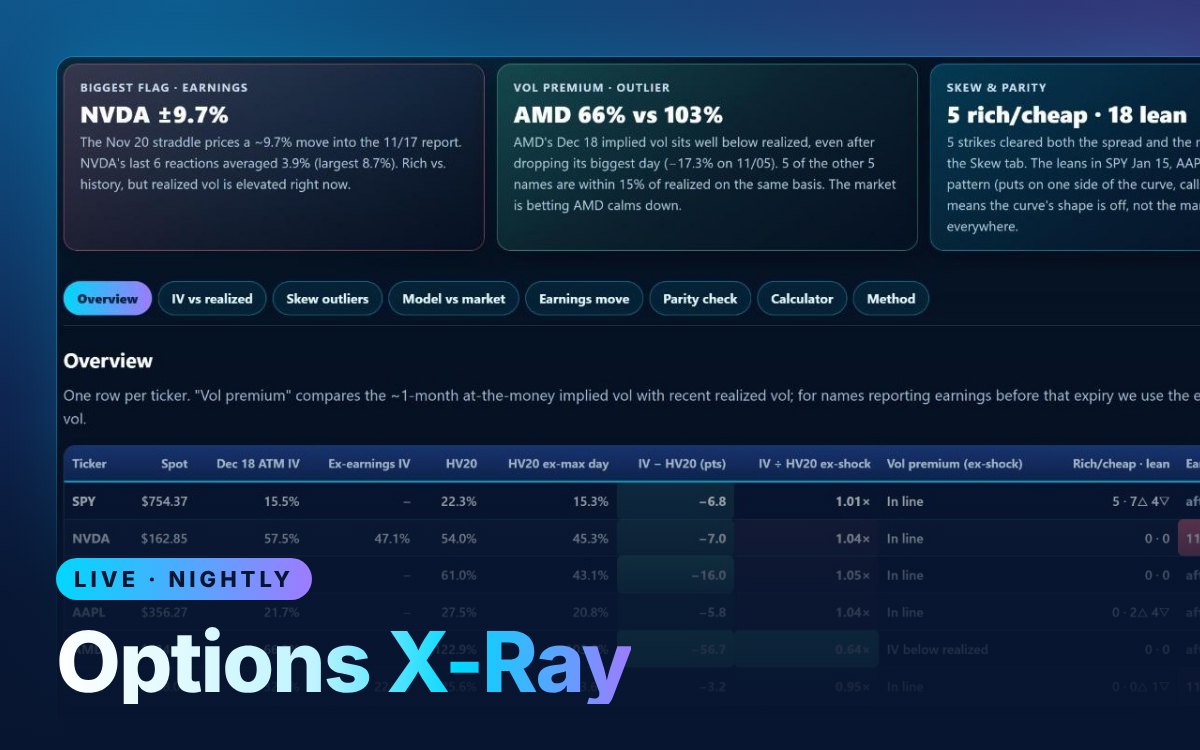
Sample screen. Subscribers see live data.
Options Flow, Gamma Levels, the Gap & Mover Scanner, the Volatility Screener, Expected Move, Options X-Ray, Unclouded Charts, the Options Chain and My Watchlist, for any symbol.
Every live tool, with AI explanations. 7-day free trial, then $49 a month. Cancel anytime.
Start 7-day free trialEvery live tool, with AI explanations. 7-day free trial, then billed once a year.
Start 7-day free trialEvery live tool plus the Unclouded Journal in one subscription, $9 a month less than buying both (Live Tools $49 + Journal $19). 7-day free trial.
Your card is charged when the free trial ends unless you cancel before then. Cancel anytime from your account.
A narrated walkthrough on real market data: what to look at first, what each number means and how traders use it.
Implied vs realized volatility, strikes that sit off the skew curve, model vs market price, and the earnings implied move compared with the stock's last six reactions, plus a put-call parity check.
Every weekday night after the close, on the full option chains for popular names such as SPY, NVDA, TSLA, AAPL, AMD and WMT.
A strike is called rich or cheap only when its whole bid-ask range is off fair value by more than the model's margin of error. Most of the time the honest answer is neither.
Enter the email you subscribed with and we'll send a one-time sign-in link.
