
Candlesticks
The open, high, low and close in one shape, what long bodies and wicks mean, and five patterns worth knowing.
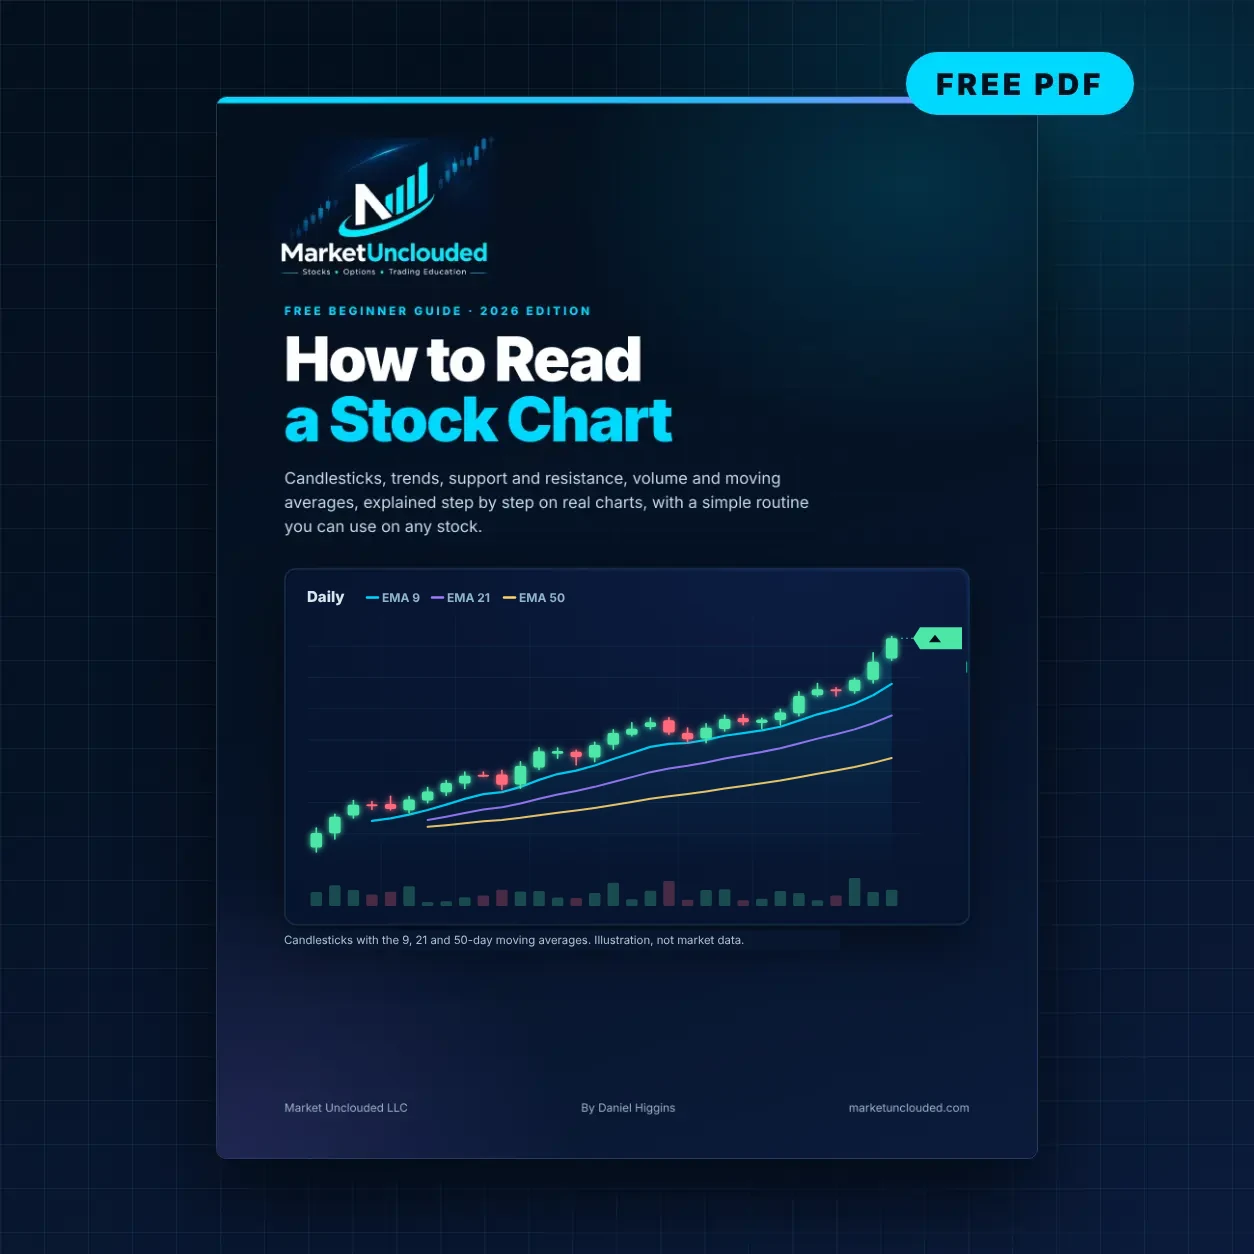
A beginner's guide to reading any chart. Candlesticks, timeframes, trends, support and resistance, volume and moving averages, explained step by step on real charts, with a simple routine you can use on any stock.
No sign-up required. Educational use only; not investment advice.
A narrated walkthrough of every chapter on real Apple (AAPL) charts: candlesticks, timeframes, trends, support and resistance, volume, moving averages, VWAP, RSI, MACD and the five-step routine.
Short chapters with clean charts drawn from real market data, illustrations, key takeaways, a one-page cheat sheet and a glossary.
The open, high, low and close in one shape, what long bodies and wicks mean, and five patterns worth knowing.
From 1-minute to monthly charts, which one matches how you trade, and why the pros read top-down.
Higher highs and higher lows, lower highs and lower lows, ranges, and how to draw a trendline that matters.
Why prices turn at the same areas, zones versus lines, role reversal and false breakouts.
Volume and relative volume, the 9, 21, 50 and 200 moving averages, VWAP, RSI and MACD.
A one-minute routine for any chart, a full worked example on Apple (AAPL), and the mistakes beginners make most.
The guide ends with a routine you can run on every chart you open, and walks through it on Apple (AAPL) with real levels and averages.
Start on the daily chart. Higher highs and higher lows, lower highs and lower lows, or a range?
The nearest support below and resistance above, how far away each is and how often it held.
Is price above or below the 9, 21, 50 and 200? Are they stacked in one direction or tangled?
Did the last big move come on heavy volume or light? Is today's volume normal for the time of day?
Zoom in, then write one sentence with the price that would prove your idea wrong.
Examples use Apple (AAPL) at the Nov 18, 2026 close, for learning only, not as a recommendation. Chart levels and indicators describe what price has done; they don't predict what it will do.
The charts in the guide are drawn from real Apple (AAPL) market data. Open the same kinds of views on the free Market Unclouded Charts tool as you read; SPY is free to chart with no account. Look up any term in the glossary, and learn the options levels in Options Terms Explained.
A downloadable educational guide, not personalized investment advice or a recommendation to buy or sell any security. Trading involves risk, including loss of principal. Examples use Apple (AAPL) market data through November 18, 2026.
Follow @MarketUnclouded to hear when the next free guide is released.