
Quick start
A complete trade in six steps, from market inputs to a full risk picture in about a minute.
A step-by-step guide to our Options Profit Calculator. Load a live option chain, read every number on the screen, and stress-test time decay and volatility before you place an order. Every example uses real calculator output.
No sign-up required. Educational use only; not investment advice.
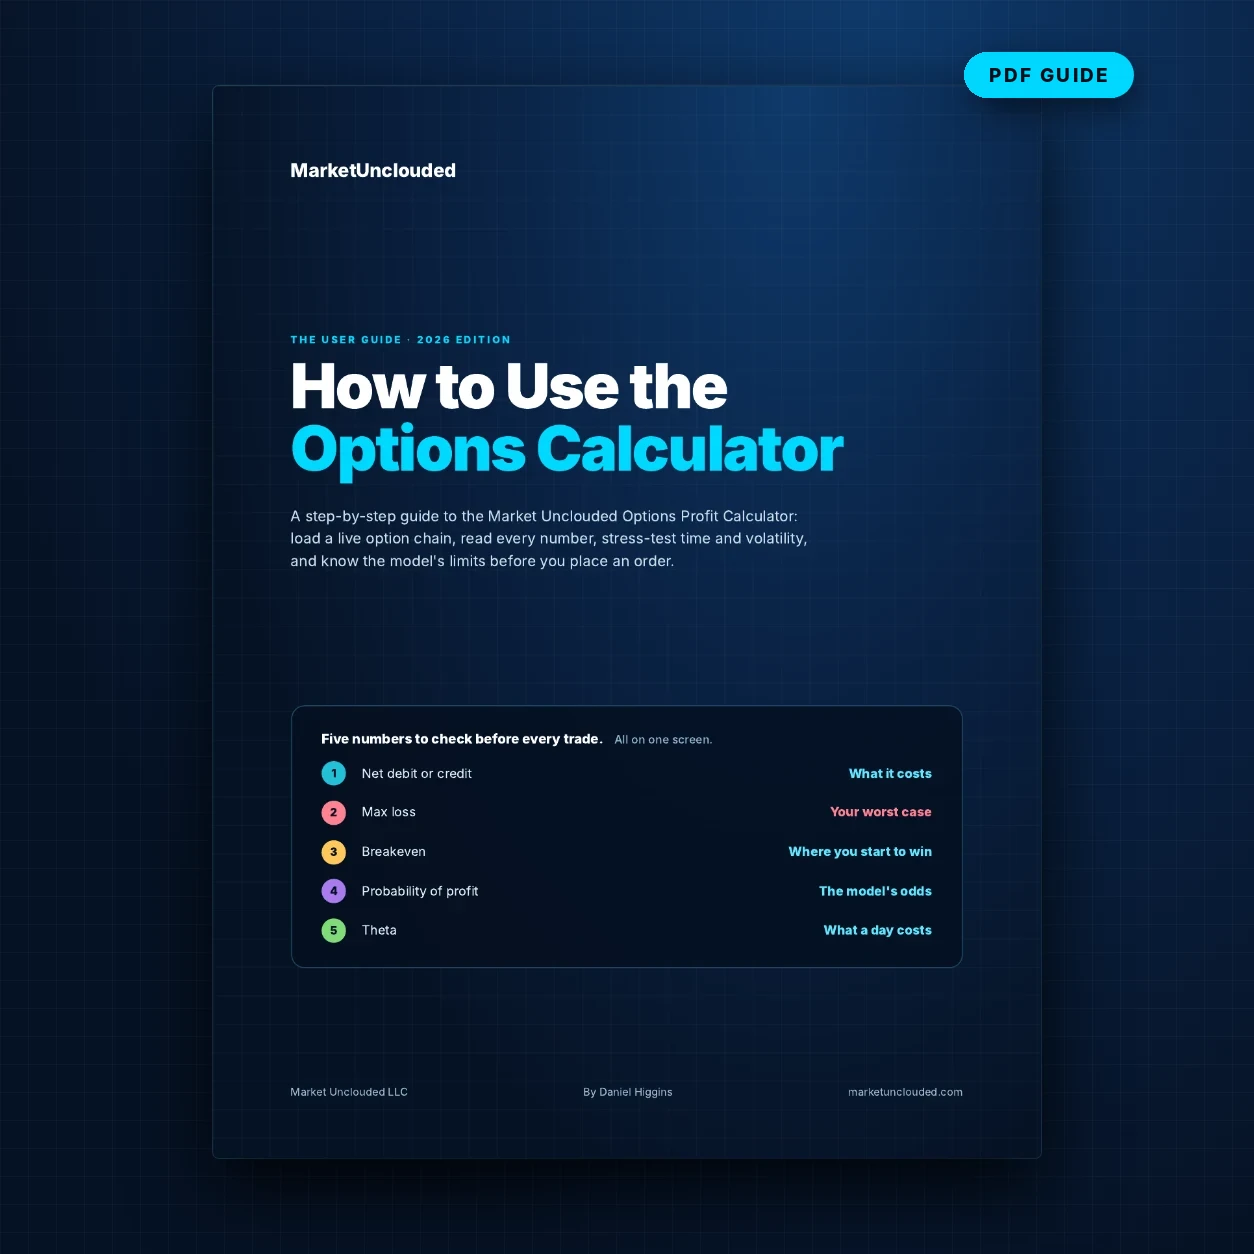
The guide walks through the calculator screen by screen, with real screenshots, the numbers behind them and a pre-trade checklist.
A complete trade in six steps, from market inputs to a full risk picture in about a minute.
Where to find each input, which IV to use, and how typing in real prices backs out each leg’s implied volatility.
Net debit or credit, max profit and loss, breakevens, probability of profit and the expected move, explained.
Delta, gamma, theta and vega in dollars, plus how to read the P/L chart, the sliders and the price-by-date grid.
How time decay drains a long call, and what a 10-point IV crush does to a straddle the day after earnings.
Long call vs. spread, an iron condor and a covered call, the model’s assumptions and a pre-trade checklist.
A bull call spread on a hypothetical $100 stock, 30 days out: buy the $100 call, sell the $107.50 call. The guide explains each one.
($3.59 − $1.06) × 100.
Both limited, at expiration.
Inside the ±$8.60 expected move.
An estimate, not a forecast.
Hypothetical illustration for education, not a recommendation. Stock at $100, 30 days to expiration, 30% implied volatility, 4% risk-free rate, model prices.
The calculator does the math. This guide shows you what each number means, where the model can mislead you, and what to check before you click Buy.
An educational guide, not investment advice. Options involve substantial risk and are not suitable for all investors; read the OCC’s Characteristics and Risks of Standardized Options before trading.
Follow @MarketUnclouded to hear when the next tool is released.