
If you have opened an options chart and seen lines marked call wall and put wall, this page is for you. They are two of the simplest options levels to read, and you do not need to trade options to use them. They come from one number that every option has: open interest.
Two quick terms first
- Strike price: the price an option is tied to. A 105 call pays off if the stock finishes above 105 at expiration.
- Open interest: how many contracts at a strike are still open, meaning someone bought them and they have not been closed yet. It is updated once a day.
Every term on this page is also in the glossary.
What is a call wall?
Look at every strike above the current price and find the one with the most open call contracts. That strike is the call wall. It often acts like a ceiling: price rallies toward it, then stalls or pulls back.
What is a put wall?
Now look at every strike below the current price and find the one with the most open put contracts. That is the put wall. It often acts like a floor: price drops toward it, then steadies or bounces.
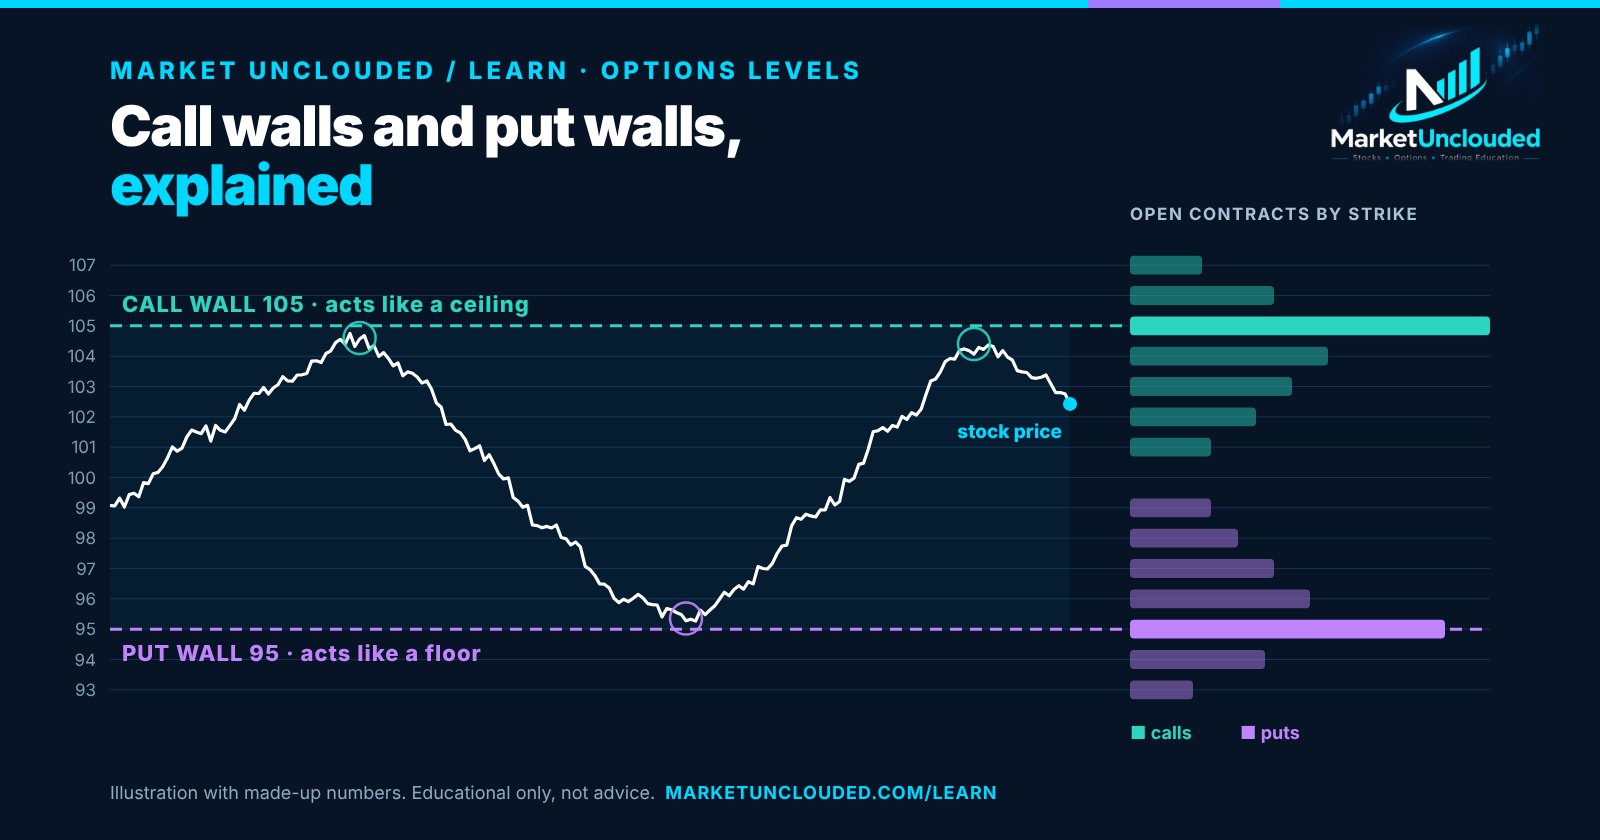
Why price often stalls near the walls
There are two simple reasons.
- Hedging. Market makers take the other side of most option trades, and they hedge by buying or selling the stock. Around a strike with a huge number of open contracts, that hedging tends to lean against the move: selling into rallies near the call wall and buying into dips near the put wall. The more contracts, the bigger the effect.
- Everyone is watching. Big strikes are often round numbers, and many traders set targets, sell covered calls or buy protection right there. When lots of people act at the same price, that price matters more.
For the deeper version, with the math behind dealer hedging, see what is gamma exposure (GEX).
A simple example
Say a stock trades at 100, and these are the open contracts near the price:
| Strike | Open calls | Open puts | What it is |
|---|---|---|---|
| 106 | 16,000 | 2,000 | |
| 105 | 40,000 | 3,000 | Call wall (most calls above 100) |
| 104 | 22,000 | 4,000 | |
| 100 | 12,000 | 11,000 | Current price |
| 96 | 3,000 | 20,000 | |
| 95 | 2,000 | 35,000 | Put wall (most puts below 100) |
| 94 | 1,000 | 15,000 |
The call wall is 105 and the put wall is 95. Between them is the range these levels often hold. If the stock rallies to 104.50 and stalls, the call wall is a likely reason. If it falls to 95.20 and bounces, that is the put wall at work.
How to use them as a beginner
- Treat them as zones, not exact prices. Price often turns a little before a wall or pokes slightly through it.
- Check where price sits. Between the walls, expect more back and forth. Pressed against one, watch for a stall or a break.
- Combine them with other levels. A wall that lines up with the expected move, max pain or your own support and resistance is stronger than a wall on its own.
- Respect a clean break. When price pushes through a wall on news or heavy volume, the move can speed up as hedges unwind. A wall is not a reason to fight a strong trend.
- Check them each day. Open interest updates every morning, so the walls can move.
Call wall, put wall, gamma flip and max pain
| Level | What it is | How traders read it |
|---|---|---|
| Call wall | Strike above price with the most open calls | Possible ceiling |
| Put wall | Strike below price with the most open puts | Possible floor |
| Gamma flip | Price where estimated dealer gamma changes from positive to negative | Above it, moves tend to be calmer; below it, bigger |
| Max pain | Strike where open options for one expiration would pay holders the least | Price sometimes drifts toward it into expiration |
You may also see the term gamma wall. Some sites use it for the strike with the most gamma, and some for either wall. Since big open interest close to the price also means big gamma, they usually point to the same area.
How we find the walls
On Market Unclouded, the walls come from open interest summed across the expirations in roughly the next five weeks, for strikes within about 10% of the price. The call wall is the strike at or above the price with the most call open interest; the put wall is the strike at or below it with the most put open interest. Open interest updates each morning, and the levels are recalculated as price moves during the day.
Limits of call walls and put walls
Open interest does not say who is long and who is short, and it misses same-day trades, including most zero-days-to-expiration activity, until the next morning. Walls hold more often in calm markets and less often around news, earnings or a strong trend. Use them as context for where price may slow down, not as a signal to buy or sell.
Common questions
What is a call wall in options?
It is the strike price above the current stock price with the most open call contracts. Because so many contracts sit there, hedging and selling often build as price gets close, so it can act like a ceiling.
What is a put wall?
It is the strike price below the current stock price with the most open put contracts. It can act like a floor, because hedging and buying often build as price falls toward it.
Is a gamma wall the same as a call wall?
Mostly. Some sites call the strike with the most gamma a gamma wall, and some use the term for either the call wall or the put wall. Big open interest close to the price usually means big gamma too, so the levels are often the same or close.
What happens when price breaks a call wall?
Sometimes the move speeds up, because traders who were hedging or selling at the wall have to buy back. Often the wall also moves higher the next day as new contracts open. A break on news or heavy volume deserves more respect than a quiet poke through.
How often do call walls and put walls change?
Open interest is published once a day, before the open, so the walls can shift each morning. They can also change during the day if the stock moves far enough that a different strike becomes the biggest one above or below the price.
Educational content only, not investment advice. Options involve substantial risk and are not suitable for all investors.